Interface III: Venous Return
Venous Return
If we return to the simple model of the circulatory system we introduced earlier, we can assume that, blood pumped from the heart moves through the arterial circulation into a reservoir. The reservoir represents both the total volume of blood contained within circulatory system and the elastic properties (compliance) of the involved vessels.

Blood volume in the reservoir is classified in two ways, stressed and unstressed volume. The unstressed volume is the blood required to fill (but not distend) the walls of vessels within the circulatory system. Unstressed volume does not support blood flow back to the heart. Stressed volume is the volume that distends vessel walls once a vessel is filled. The distending pressure created by stressed volume in the reservoir is called the mean systemic pressure (Pms) and is a primary determinant of blood flow toward the heart. Pms, represents the mean blood pressure within the systemic circulation. Since the majority of blood volume in the body is contained within the venous system, Pms is actually quite low (~8-10mmHg).

Adapting the Hagen-Poiseuille Law to Venous Circulation
Blood flow from the reservoir toward the heart is passively driven by the pressure gradient between the mean systemic pressure (Pms) and the downstream right atrial pressure (PRA), in accordance with the principles of the Hagen–Poiseuille law which is used to describe laminar flow through cylindrical tubes. In this context, the venous return from the reservoir to the heart can be expressed as the pressure gradient between the upstream Pms and the downstream PRA, divided by the resistance to flow (Rv) within the venous circuit. This relationship mirrors the structure of Ohm’s law in electrical circuits (see equation below), where the flow (analogous to current) is driven by the pressure difference (analogous to voltage) and is inversely proportional to the resistance within the circuit. However, the fundamental origin of the equation lies in the Hagen–Poiseuille law, which governs fluid dynamics in this scenario.
Pressure : Flow Relationship
- An adaptation of Hagen- Poiseuille and Ohm's Laws


The Guyton Curve
In the 1950’s, Arthur Guyton demonstrated the determinants of venous return graphically in what are now called a Guyton curve or venous return curve. The Guyton curve demonstrates the relationship between venous return (Flow) on the Y-axis and right atrial pressure (PRA) on the X-axis. The slope of this curve represents the resistance to venous return. Understanding the curve and how manipulations to Pms, PRA, or Rv influences it is important to fully understanding hemodynamic physiology.
Let's explore the Guyton curve further.

Mean Systemic Pressure (Pms):
Based on the Pressure:Flow equation above, when the right atrial pressure (RAP) and the mean systemic pressure (Pms) are equal (no pressure gradient), flow will cease. This point corresponds is represented by the x-intercept of the venous return curve on the pressure axis where venous return equals zero.

Manipulating the Pms
Pms can be altered in two distinct ways:
Method #1: The total volume of the reservoir could be changed (Fig. A). This occurs with the addition or removal of fluids.

Fig. A: Assuming favorable venous compliance, the addition of intravascular volume leads to an increase in Pms by expanding the stressed volume compartment.
The net effect of changes to stressed volume (Pms) is to move the x-intercept of the venous return curve left or right.

This illustrates the effect a fluid bolus has on venous hemodynamics. As we can see, a fluid bolus would cause a rightward shift of the curve by raising Pms. This would yeild a greater flow (venous return) for a given PRA

Method #2: The compliance (or diameter) of the reservoir can be altered in such a way that the proportion of stressed to unstressed volume is shifted (Fig. B). Systemic vasodilation or constriction from changes in neural tone, catecholamine responses, or the use of exogenous vasoactive medications all have the potential to modify vascular compliance. When Pms is increased by this method, the effect on the venous return curve is identical to above; it shifts to the right and the result is that a higher flow rate will result at a given Pra.

Fig. B: Systemic vasoconstriction decreases overall venous compliance, shifting fluid from unstressed volume to stressed volume, despite no net addition of fluid. When a vasopressor with venular tropism is administered, venous compliance decreases, converting unstressed volume into stressed volume and thereby increasing mean systemic filling pressure (Pmsf).
Clinical Pearl:
Interestingly, profound inflammatory states may lead to insufficient cardiac performance, even when cardiac output appears relatively normal. In such scenarios, a potential strategy is to employ a vasoconstrictor (which will shift unstressed volume into stressed volume) and an inotrope which can increase cardiac performance (with β₁-adrenergic properties). Both norepinephrine and epinephrine achieve this goal. When Pms is increased via a reduction in venular compliance (via Method #2), increased cardiac performance (via β₁-adrenergic properties) results in a synergistic enhancement of cardiac output (see animation below).

In this animation, the addition of norepinephrine or epinephrine causes two key changes. First - venoconstriction from alpha -1 receptor agonism causes a shift in unstressed volume toward stressed volume (as shown in Figure B above.) The effect of this is a rightward shift of the Guyton curve (increased Pms) as demonstrated by the blue line. Second- the inotropic effect of beta 1 agonism causes an upward shift of the Starling curve as demonstrated by the red line. (For further reading about this effect, click here.
Right Atrial Pressure (PRA)
Right Atrial Pressure (PRA) is a fascinating parameter with significant physiological meaning. It is often used interchangeably with central venous pressure (CVP) which is readily measurable in any patient with a central venous catheter. In addition, its clinical utility has been frequently questioned, often unfairly. Much of this criticism arises from a misunderstanding of what RAP/CVP truly represents.
In simple terms, CVP is not an isolated variable. Rather, it is the point of equilibrium between two curves:
-
The venous return curve (Guyton curve), which describes how blood flows from the systemic circulation back to the heart, and
-
The ventricular function curve (Starling curve), which represents the heart’s ability to pump blood forward.
Because CVP is the result of this interaction, it cannot be interpreted independently. It is not merely a "volume status number," but a dynamic reflection of the cardiovascular system’s balance between venous return and cardiac performance.
Determinants of CVP
1. Cardiac Function: Cardiac function (both right and left ventricular function) moves blood away from the right heart which reliably lowers PRA. But because the majority of the body's blood volume is stored in high-capacitance systemic veins (the stressed and unstressed reservoirs), cardiac function has little effect on mean systemic pressure (Pms). By lowering PRA, improved cardiac function increases the pressure gradient between Pms and PRA, which increases venous return.
2. Pleural Pressure: Because the heart lies within the thoracic cavity and the right atrial free wall is thin, pleural pressure changes are transmitted almost directly to the right atrium. This means that respiratory mechanics, mechanical ventilation, and intrathoracic pressure shifts (ie: tension pneumothorax) can significantly affect measured PRA. Changes in PRA affect the Pms-PRA pressure gradient which influences venous return.
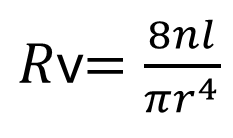
Resistance to Venous Return (Rv)
Now let us transition to the final variable in the venous return equation- resistance.
According to Ohm's law, resistance can be expressed as the relationship between pressure and flow. On a Guyton curve, this is represented graphically by the slope of the venous return curve:
-
Increased resistance → flatter slope, meaning less flow for any given pressure gradient.
-
Decreased resistance → steeper slope, allowing greater flow at the same pressure gradient.
Thus, changes in venous resistance shift the efficiency of venous return without altering the zero flow equilibrium point where PRA=Pms, unless the stressed volume or PRA also change.
Like Pms and PRA, venous resistance (Rv) is influenced by many factors.
The equation highlights its main determinants:
-
η = blood viscosity
-
l = length of the blood vessels
-
r = vessel radius (to the 4th power)
For our purposes, we can ignore the small variations in blood viscosity or vessel length throughout the venous system. However, what is important to appreciate is that, due to the sheer number of capillaries and venules in the human body, their combined cross-sectional area is gigantic. The net result is that they contribute very little to overall venous resistance. On the other hand, vessels with a much smaller cross-sectional area (particularly the venae cavae,) account for the majority of venous resistance in the circulation.
Clinical Pearl:
Because most venous resistance is concentrated in the venae cavae and major intrathoracic veins, any process that reduces their cross-sectional area can dramatically increase Rv.
Examples include:
-
Elevated intra-abdominal pressure (e.g., abdominal compartment syndrome) compressing the IVC.
-
SVC syndrome or central venous thrombosis.
-
External compression by tumors or mediastinal masses.
In these scenarios, venous return becomes markedly flow-limited, and interventions that reduce resistance (decompression, stenting) can rapidly improve cardiac output.


Why the Venous Return Curve Flattens: A Primer on Flow Limitation
REFERENCES
-
Norepinephrine exerts an inotropic effect during the early phase of human septic shock. Hamzaoui O, Jozwiak M, Geffriaud T, Sztrymf B, Prat D, Jacobs F, Monnet X, Trouiller P, Richard C, Teboul JL. Br J Anaesth. 2018 Mar;120(3):517-524. doi: 10.1016/j.bja.2017.11.065. Epub 2017 Nov 21. PMID: 29452808.

© 2035 by Hemodynamics Hub. Powered and secured by Wix