Interface I: Cardiac Function
Cardiac Function
In the early 20th century, Henry Starling and E.B. Patterson concocted an experimental model to further earlier work by Otto Frank related to the relationship between cardiac myocyte stretch (preload) and contractile force (cardiac function). The Starling-Patterson experiment, a cornerstone of cardiac physiology, used an isolated dog heart preparation to show that the force of cardiac contraction increases with the increasing preload; a principle now known as Starling’s Law of the Heart.
Patterson SW, Starling EH. J Physiol. 1914;48:357–79.
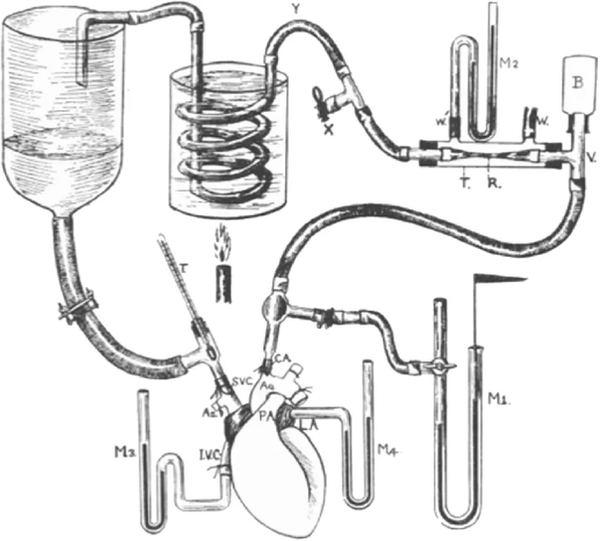
This image above depicts Starling’s isolated heart-lung preparation. The setup included the following:
-
An isolated dog heart and lungs
-
A reservoir of blood which allowed precise control of venous return to the right atrium (based on how much one raised or lowered the height of the venous reservoir above the heart.) Altering the height of the reservoir allowed Starling to vary the filling pressure of the ventricle (what we now call preload).
Through this elegant preparation, they showed that:
-
Variations in stroke volume and cardiac output occur with differing levels of preload.
-
As preload increases, muscle fibers in the heart stretch. Up to a point, as the length of the muscle fiber increases, the strength of the ventricular contraction increases. This is due to the length-dependent activation of cardiac myocytes; stretching sarcomeres enhances cross-bridge formation and increases myofilament sensitivity to calcium, thereby augmenting contractile force.
-
On a more systemic level, this means that that increasing ventricular filling (preload) leads to greater stroke volume.
Given Patterson’s junior role under Starling, his name remains merely a footnote in the annals of medical history. But the concepts described show how the intrinsic properties of the heart respond to variations in preload.

In clinical practice, the Frank-Starling curve remains central to understanding both normal physiology and pathological states such as heart failure, where the length–tension relationship is altered.
The Curve
The Frank–Starling curve provides a graphical way to understand how changes in filling pressure influence cardiac output.
-
On the Frank-Starling curve, increasing right atrial pressure (PRA) — a surrogate for preload — leads to a higher cardiac output (Flow). This is explained by greater myocyte stretch during diastolic filling, which enhances contractile force (length-dependent activation).
Changes in Cardiac Function
The slope and position of the Starling (cardiac function) curve is determined by cardiac performance.
-
When cardiac function decreases (e.g., reduced contractility, volume overload, or severely increased afterload), the Starling curve shifts downward, meaning that for any given preload, stroke volume and cardiac output are reduced.
-
Conversely, when cardiac function improves (e.g., enhanced contractility, reduced afterload), the curve shifts upward, allowing higher stroke volume and output for the same preload.

Effect of pleural pressure on the Frank-Starling curve
Recall that pressures within the vascular space are measured relative to the atmosphere outside the body. Because the right atrium sits within the pleural cavity and is a thin walled cavity, fluctuations in pleural pressure (or intrathoracic pressure) across the respiratory cycle cause RAP to similarly increase or decrease relative to the constant atmospheric pressure outside the body.
%203_18_02%E2%80%AFp_m_.png)
Here’s a simple plot showing time (x-axis) and pressure relative to atmosphere in mmHg (y-axis). The x-axis represents atmospheric pressure (0 mmHg). The solid blue line represents a right atrial pressure waveform with normal respiratory swings, dipping during spontaneous inspiration and rising during expiration.
On a Starling curve, the effect of pleural pressure on cardiac function is best explained by imagining a state where the pumping function of the heart were transiently stopped (ie: cardiac arrest). In such a state, cardiac output (flow) should be zero. On the Starling curve, such a state would be represented at the point where the curve meets the x-axis (the x-intercept). Since flow is zero at this point, the measured preload or right atrial pressure in such a state only changes if the pleural pressure around the heart changes. With each respiratory cycle, pleural pressure fluctuations cause the Starling (cardiac function) curve to shift right or left.
-
Spontaneous inspiration lowers pleural pressure (relative to atmospheric pressure), reducing PRA and shifting the Starling curve leftward. Expiration would have the opposite effect on preload (PRA) due to a relative increase in pleural pressure.
-
When a patient is mechanically ventilated and passive (positive pressure ventilation,) inspiration raises pleural pressure. In this case, PRA increases, shifting the Starling curve rightward.

In other words, respiratory mechanics must always be considered when interpreting PRA, because what is being measured is not just intracardiac pressure but the balance between intracardiac and surrounding thoracic pressures.
The Starling curve reflects the heart’s ability to transform preload into forward flow. Because the volume of blood going into the heart (venous return) must equal that being pumped out (cardiac function) over time, it is important not to look at Starling curves in isolation. Understanding how the Frank-Starling curve (red curve below) interacts with determinates of venous return, highlighted by Guyton curves (blue curve below), offers a more wholistic picture of factors affecting a patient’s cardiac output.

References:
-
On the mechanical factors which determine the output of the ventricles. Patterson SW, Starling EH. J Physiol. 1914;48:357–79.
-
Functional Significance of the Frank-Starling Mechanism Under Physiological and Pathophysiological Conditions. Jacob R, Dierberger B, Kissling G. European Heart Journal. 1992;13 Suppl E:7-14. doi:10.1093/eurheartj/13.suppl_e.7.
-
Static Filling Pressure in Patients During Induced Ventricular Fibrillation. Schipke JD, Heusch G, Sanii AP, Gams E, Winter J. American Journal of Physiology. Heart and Circulatory Physiology. 2003;285(6):H2510-5. doi:10.1152/ajpheart.00604.2003.
-
The Role of Venous Return in Critical Illness and Shock—Part I: Physiology. Funk DJ, Jacobsohn E, Kumar A. Critical Care Medicine, 2013; 41(1):255–262. doi: 10.1038/pr.2012.201.
-
Determination of cardiac output by equating venous return curves with cardiac response curves. Guyton A.C. Physiol Rev. 1955; 35(1):123-129. doi: 10.1152/physrev.1955.35.1.123.